I rarely debug the client-side JS codes, or I can say NEVER! I have tried to debug it using Script Explorer today and it impressed me. To debug the client-side JavaScript functions, you can use the only-visible-in-debugging-environment Script Explorer in Visual Studio 2003/2005. There are few steps need to be followed:
1. Enable Client-side Script Debugging
IE -> Tools Menu -> Options Menu -> Advanced Tab -> Untick " Disable script debugging check box" in Browsing category.

2. In VS environment, write a simple JS function in external functions.js
function MyLoad(name)
{
   var message = "Welcome, " + name;
   alert(message);
}
Then, invoke the function in body's load() event in ASPX page.
window.onload = MyLoad("Alvin");
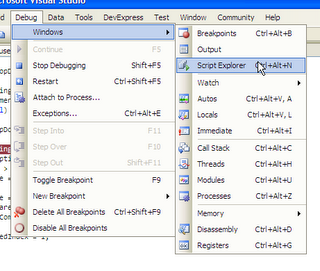
3. Press F5 to debug the page. In debug mode, go to Debug Menu->Windows-> Script Explorer (this option only appears in debug mode). The window of Script Explorer will be shown.

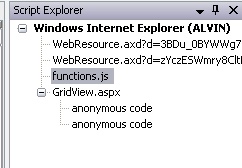
4. Once you debugging the page, you will see list of JS files/resources shown in Script Explorer in tree view.

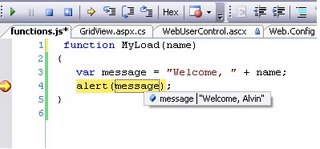
Double click the "functions.js" and set the breakpoint at particular line. The debugger will stop at that line when it passing through it.

Additionals
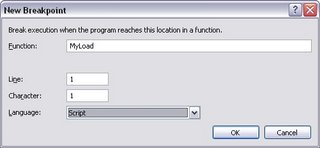
If your javascript functions are in the aspx page, you can add breakpoint by
Debug Menu -> "Add Breakpoint" -> "Break At Function" -> type your method name there and choose right language.

Read more in MSDN
1. How to: Debug a Client-Side Script from Microsoft Internet Explorer
2. How to: Enable Client-Side Script Debugging
3. How to: Set a Function Breakpoint
I need a break....
No comments:
Post a Comment